Introduction: A/B testing is a valuable technique for businesses seeking to optimize their online presence and marketing strategies. It allows organizations to compare different versions of a webpage, email, or any other marketing asset to determine which one yields better results. However, to fully comprehend and harness the power of A/B testing, it is essential to have a solid statistical understanding. In this blog post, we will delve into the statistical concepts behind A/B testing, providing you with the knowledge necessary to make informed decisions with confidence.
- Hypothesis Testing: A/B testing relies on the principles of hypothesis testing, a statistical method that helps assess the validity of a claim or hypothesis. In the context of A/B testing, the null hypothesis (H0) states that there is no significant difference between the control and experimental groups, while the alternative hypothesis (H1) suggests that there is a significant difference. By collecting data from both groups and conducting statistical tests, we can evaluate the evidence against the null hypothesis and make conclusions about the effectiveness of the variations being tested.
- Sample Size Determination: To ensure the reliability and validity of A/B test results, it is crucial to determine an appropriate sample size. Inadequate sample sizes can lead to inconclusive or unreliable findings, while excessively large sample sizes can be a waste of resources. Statistical techniques, such as power analysis, can help determine the minimum sample size required to detect a meaningful difference between the control and experimental groups with a desired level of statistical power and significance.
- Randomization and Control: Randomization is a fundamental aspect of A/B testing. It involves randomly assigning participants or users to the control and experimental groups to ensure that any differences in outcomes can be attributed to the variations being tested rather than other factors. Randomization helps mitigate bias and ensures that the groups are comparable in terms of relevant characteristics. Additionally, having a control group allows for a baseline comparison, providing a reference point to measure the impact of the experimental variation.
- Statistical Significance: Statistical significance is a concept that helps determine whether the observed differences between the control and experimental groups are statistically meaningful or simply due to chance. It is usually expressed as a p-value, which represents the probability of obtaining results as extreme as or more extreme than the observed results, assuming the null hypothesis is true. A commonly used significance level is 0.05, indicating that if the p-value is below this threshold, we reject the null hypothesis and conclude that there is a significant difference.
- Confidence Intervals: While statistical significance provides insights into the presence of a significant difference, it does not quantify the magnitude or direction of the effect. Confidence intervals help address this limitation by providing a range of values within which the true population parameter is likely to fall. By calculating confidence intervals around the observed metrics, such as conversion rates or click-through rates, we can obtain a more comprehensive understanding of the potential impact of the variations being tested.
- Iterative Testing and Multiple Comparisons: A/B testing is an iterative process that involves running multiple tests over time to refine and optimize marketing strategies continually. However, it is important to be cautious when interpreting results from multiple comparisons. Without proper statistical adjustments, conducting multiple tests can increase the likelihood of false positives (Type I errors). Techniques like Bonferroni correction or the false discovery rate (FDR) can help mitigate this issue by controlling the overall error rate.
Calculation involved in A/B testing
Now we will dive into the statistical understanding and calculations behind A/B testing. A/B testing is a powerful tool for businesses to optimize their marketing strategies and make data-driven decisions. In this post, we will provide a clear example and guide you through the step-by-step calculations involved in A/B testing, allowing you to gain hands-on experience and a deeper understanding of the statistical concepts at play.
Scenario: Let’s imagine you manage an online clothing store and want to test two different versions of your homepage to determine which one leads to higher conversion rates. You randomly assign visitors to either Group A (the control group) or Group B (the experimental group) and collect data on their conversion behavior.
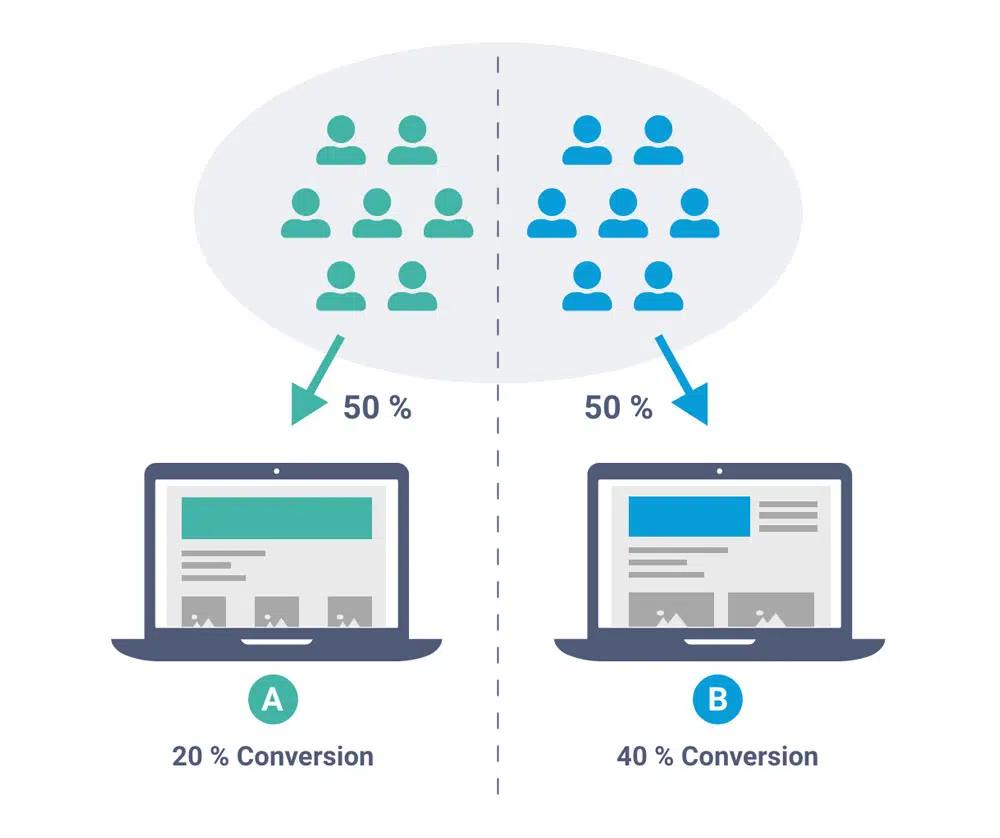
Step 1 : Data Collection Collect data on the number of visitors and conversions for each group. For simplicity, let’s consider a sample size of 500 visitors in each group.
- Control Group A:
- Visitors: 500
- Conversions: 50
- Experimental Group B:
- Visitors: 500
- Conversions: 70
Step 2: Conversion Rates Calculation Calculate the conversion rates for each group by dividing the number of conversions by the total number of visitors in each group.
- Control Group A Conversion Rate: 50 / 500 = 0.1 or 10%
- Experimental Group B Conversion Rate: 70 / 500 = 0.14 or 14%
Step 3: Hypothesis Testing and p-value To determine if there is a statistically significant difference between the conversion rates of the two groups, we conduct a hypothesis test. The null hypothesis (H0) assumes no significant difference, while the alternative hypothesis (H1) suggests there is a significant difference.
In hypothesis testing, we calculate a test statistic and its associated p-value. The p-value represents the probability of observing a difference as extreme as or more extreme than the one observed, assuming the null hypothesis is true. If the p-value is smaller than a chosen significance level (usually 0.05), we reject the null hypothesis and conclude that there is a significant difference.
In our example, we can use a statistical test such as the chi-square test or the Z-test to analyze the data and calculate the p-value. Let’s assume we perform a Z-test, and we obtain a p-value of 0.02.
Step 4: Interpretation of Results Since the p-value (0.02) is below the chosen significance level (e.g., 0.05), we reject the null hypothesis and conclude that there is a significant difference between the two versions of the homepage. This suggests that the experimental group’s higher conversion rate is likely not due to chance but is a result of the variation being tested.
Step 5: Confidence Intervals To understand the precision and reliability of the observed differences, we can calculate confidence intervals around the conversion rates. Confidence intervals provide a range of values within which the true population parameter is likely to fall.
For example, calculating a 95% confidence interval for Group A conversion rate:
- Control Group A Conversion Rate: 10%
- Sample Size (n): 500
- Margin of Error: 1.96 * sqrt((0.1 * (1 – 0.1)) / 500) ≈ 0.0196 (approximated for simplicity)
Confidence Interval: 10% ± 1.96 * 0.0196 = (8.97%, 11.03%)
Repeat the same process to calculate the confidence interval for Group B conversion rate.
Conclusion: By actively engaging in this interactive blog post, you have gained a better understanding of the statistical calculations involved in A/B testing. You learned about the p-value, which represents the probability of observing a difference as extreme as or more extreme than the one observed, assuming the null hypothesis is true. A p-value below the significance level indicates a significant difference and allows us to reject the null hypothesis. By incorporating these statistical concepts into your A/B testing process, you can make data-driven decisions and optimize your marketing strategies effectively.