In Tableau, dimensions and measures are two important types of data fields.
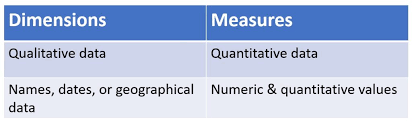
A dimension is a categorical variable that contains discrete values, such as geographic locations, product categories, or time periods. Dimensions are typically used to define the structure of a visualization, and to group, filter, or aggregate data. Examples of dimensions in Tableau include “Region,” “Category,” and “Date.”
A measure, on the other hand, is a numerical value that can be aggregated, such as sales revenue, profit, or quantity. Measures are used to perform mathematical operations, such as summing, averaging, or counting data. Examples of measures in Tableau include “Sales,” “Profit,” and “Quantity.”
In Tableau, you can use dimensions and measures to create visualizations such as bar charts, line graphs, and scatter plots. Understanding the difference between dimensions and measures is essential for designing effective visualizations and for using Tableau’s features effectively.
This video illustrates Dimension and Measure in tableau .