Tableau is a popular data visualization and business intelligence tool used by organizations to turn complex data sets into interactive and insightful visualizations. In this article, we will discuss the history, features, and benefits of Tableau.
History of Tableau
Tableau was founded in 2003 by Chris Stolte, Christian Chabot, and Pat Hanrahan in Mountain View, California. The goal of the company was to develop a tool that would allow users to visualize and analyze data in a way that was more accessible than traditional business intelligence tools.
In 2004, Tableau released its first product, Tableau Desktop, which allowed users to connect to a variety of data sources and create interactive dashboards and visualizations. The company quickly gained popularity among data analysts and business users who were looking for a more intuitive and user-friendly way to analyze data.
In 2013, Tableau went public and began offering additional products and services, such as Tableau Server and Tableau Online, which allowed users to share their visualizations and collaborate with others in the organization.
Tableau was acquired by Salesforce in 2019, and has continued to evolve and expand its offerings under the Salesforce umbrella.
Benefits of Tableau
Tableau offers a number of benefits to organizations looking to improve their data analysis and visualization capabilities. Some of the key benefits of Tableau include:
- Easy to Use: Tableau is designed to be intuitive and user-friendly, making it easy for non-technical users to create and interact with visualizations.
- Powerful Analytics: Tableau includes powerful analytics tools that allow users to explore data in greater detail and uncover insights that might not be visible in traditional reports or dashboards.
- Improved Collaboration: Tableau allows users to share their visualizations with others in the organization, making it easy to collaborate and share insights.
- Increased Efficiency: Tableau automates many of the data preparation and analysis tasks, allowing users to focus on the insights and analysis rather than the mechanics of data manipulation.
- Better Decision Making: Tableau enables users to visualize data in new ways, making it easier to identify patterns and trends, and ultimately make better decisions based on data-driven insights.
Different Software options by Tableau
Tableau offers a range of products and services to meet the needs of different users. In this article, we will compare Tableau Desktop, Tableau Public, and Tableau Reader, three of the most commonly used Tableau products.
Which product is right for you?
The choice between Tableau Desktop, Tableau Public, and Tableau Reader depends on your needs and use case. If you are a business professional or analyst who needs to create and share data visualizations within your organization, Tableau Desktop is the right choice for you. If you are an individual, journalist, or blogger who wants to share data stories with the world, Tableau Public is a good option. If you simply need to view and interact with visualizations created by others, Tableau Reader is the way to go.
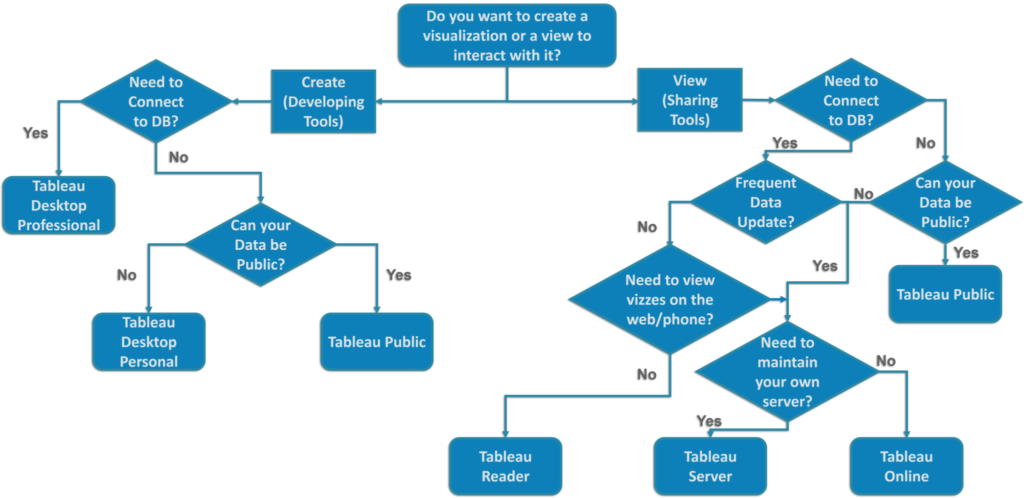
Tableau Desktop vs Tableau Pulic vs Tableau Reader
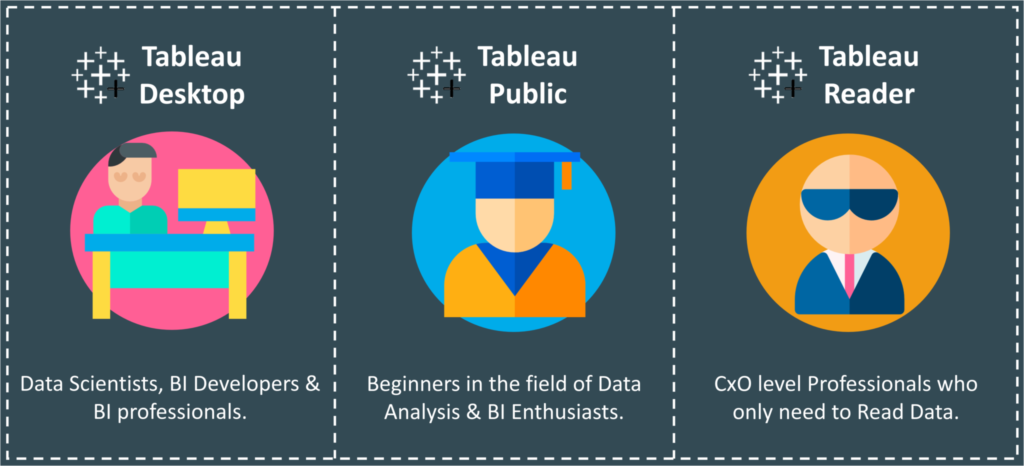
Tableau Desktop
Tableau Desktop is the primary product offered by Tableau and is designed for business professionals and analysts who need to create and share data visualizations within their organization. Tableau Desktop is a powerful tool that offers a wide range of features and capabilities
- Data Connection: Tableau Desktop allows users to connect to a wide variety of data sources, including Excel, CSV, SQL databases, and cloud-based platforms like Amazon Redshift and Google BigQuery.
- Data Visualization: Tableau Desktop allows users to create interactive dashboards, charts, and graphs that can be customized to meet specific needs. Users can choose from a wide range of visualization types, including bar charts, line charts, scatterplots, and heat maps.
- Data Blending: Tableau Desktop allows users to blend data from multiple sources, making it easy to combine data from different departments or systems into a single visualization.
- Data Analysis: Tableau Desktop includes powerful data analysis tools that allow users to explore data in greater detail, identify trends and patterns, and uncover insights.
- Collaboration: Tableau Desktop allows users to share their visualizations with others in the organization, making it easy to collaborate and share insights.
- Mobile Support: Tableau Desktop supports mobile devices, making it easy to access and interact with visualizations on the go.
Tableau Public
Tableau Public is a free version of Tableau that allows users to create and share data visualizations with anyone online. Tableau Public is designed for individuals, journalists, and bloggers who want to share data stories with the world. Some of the key features of Tableau Public include:
- Data Connection: Tableau Public allows users to connect to a wide variety of data sources, including Excel, CSV, SQL databases, and cloud-based platforms like Google Sheets.
- Data Visualization: Tableau Public allows users to create interactive dashboards, charts, and graphs that can be customized to meet specific needs. Users can choose from a wide range of visualization types, including bar charts, line charts, scatterplots, and heat maps.
- Collaboration: Tableau Public allows users to share their visualizations with anyone online, making it easy to collaborate and share insights.
- Data Security: Tableau Public is designed to be used with public data sets only, and does not offer the same level of data security as Tableau Desktop.
Tableau Reader
Tableau Reader is a free desktop application that allows users to view and interact with Tableau visualizations created by others. Tableau Reader is designed for users who need to view visualizations but do not need to create or modify them. Some of the key features of Tableau Reader include:
- Data Visualization: Tableau Reader allows users to view and interact with Tableau visualizations created by others.
- Data Security: Tableau Reader offers the same level of data security as Tableau Desktop, ensuring that sensitive data is not exposed to unauthorized users.
- Collaboration: Tableau Reader allows users to view and interact with visualizations created by others, making it easy to collaborate and share insights.
Tableau Data Terminology
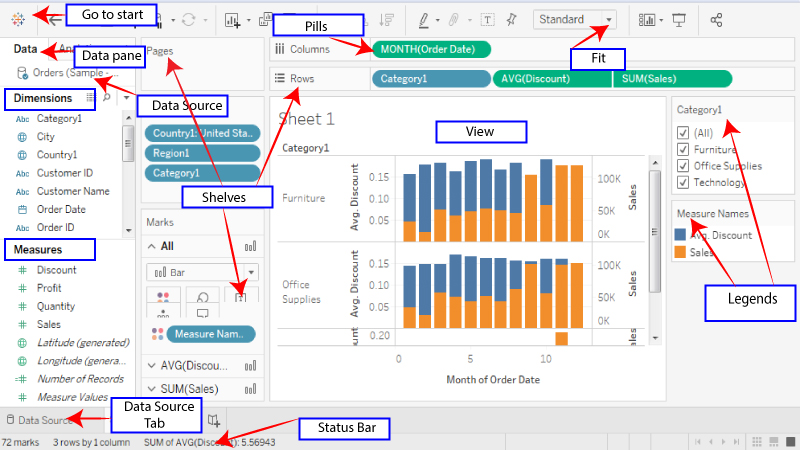
Tableau uses a range of data terminology to help users understand their data better. Here are some of the key terms and concepts used in Tableau:
Understanding these terms is important for working effectively with Tableau and creating visualizations that communicate your data effectively.
- Data Source: This refers to the data file or database that contains the data that you want to visualize in Tableau. Tableau can connect to a wide range of data sources, including spreadsheets, databases, and cloud-based services.
- Dimensions: These are the categories or groupings that you use to analyze and segment your data. Examples of dimensions include time, geography, product categories, and customer segments.
- Measures: These are the numeric values that you use to perform calculations and analyze your data. Examples of measures include sales revenue, profit margins, and customer counts.
- Aggregation: This refers to the process of combining and summarizing data at a higher level. Tableau offers a range of aggregation functions, including SUM, AVG, MIN, MAX, and COUNT.
- Filters: These are used to narrow down the data that you want to analyze by selecting specific values or ranges of values. Filters can be applied to dimensions or measures.
- Calculated fields: These are custom calculations that you create using your data. Calculated fields can be used to perform complex calculations, create new dimensions or measures, or transform existing data.
- Joins: This is the process of combining data from two or more tables or data sources based on a common field. Tableau supports different types of joins, including inner join, left join, right join, and full outer join.
- Hierarchies: These are used to organize dimensions into a hierarchical structure, allowing you to drill down and analyze your data at different levels of detail.
- Blending: This is the process of combining data from multiple data sources in a single visualization. Tableau offers a range of blending options, including data blending, data blending with joins, and data blending with relationships.
- Parameters: These are dynamic values that can be used to control and adjust various aspects of a visualization. Parameters can be used to filter data, control colors or sizes, and adjust axis ranges, among other things.
- Pills: In Tableau, pills refer to the small rectangular boxes that contain dimensions or measures. These pills are used to build and modify visualizations in the view. For example, to create a scatter plot, you would drag one pill to the Rows shelf and another pill to the Columns shelf.
- Shelves: Shelves are the areas on the left and top of the Tableau worksheet where pills can be dragged and dropped to build a visualization. The Columns shelf is on the top, and the Rows shelf is on the left. Other shelves include the Marks shelf, which controls the type and appearance of marks, and the Filters shelf, which contains filters that can be applied to the data.
- Legends: Legends are used to provide context and information about the data in a visualization. They are often displayed on the right-hand side of a visualization and provide information about colors, sizes, shapes, or other visual elements. Legends can be customized to show different levels of detail, and they can also be used to filter the data.
- Fit: The fit option in Tableau refers to the way that the visualization is displayed on the screen or printed on paper. Tableau offers several options for fitting a visualization to a specific size or aspect ratio, including Automatic, Fit Width, Fit Height, and Entire View. These options can be found in the toolbar or under the “Size” menu.